|
Ψ Variations in Physique
• Each year, the typical well-nourished school-aged child gains about 5 pounds & grows about 3 inches.
• For poor nations, variations in weight & height is due mostly to malnutrition; in wealthier nations, genes seem to play a greater role
Ψ Childhood Obesity
• Being overweight is the largest & most common problem in school-age children. Nearly 1/3 of North American children are obese.
• Obese children are prone to orthopedic & respiratory problems, along with a high risk for other illnesses. Causes of childhood obesity include:
• Heredity
• Lack of exercise
• Television
• Cultural attitudes
• Precipitating events
Ψ The most common cause of school absence in many developed nations, & especially in cities is
asthma. Asthma is a chronic, inflammatory disorder of the air ways.
Ψ Causes of asthma? Civilization.
Ψ Prevention of Asthma
• Primary: Proper ventilation of schools & homes, decreases pollution, eradication of cockroaches, & safe play spaces.
• Secondary: Depends on families, if there is a genetic history of allergies, ridding the house of allergens before the disease appears &
breast feeding newborns can cut the rate of asthma in half.
• Tertiary: Prompt use of injections, inhalers, & pills. Less than half in U.S. receive
adequate tertiary prevention.
Ψ Body Mass Index - a measure of obesity determined by dividing weight in kilograms by height squared in meters - Less than 18 is ok for children.
   Formula for BMI Formula for BMI   
Ψ BMI = w/h2 where:
w = weight in kilograms (pounds divided by 2.2)
h = height in meters (inches divided by 39.4)
OR: BMI = Weight in pounds divided by ( height in inches times height in inches ) times 703. That is (in Imperial units): BMI = w/h2 x 703
Ψ Table For Adults;
• below 18 on the BMI scale is considered anorexic.
• between 19 & 25 is "good".
• 26 to 30 is considered overweight.
• 30 or above is considered obese.
• 40 or above is considered morbidly obese.
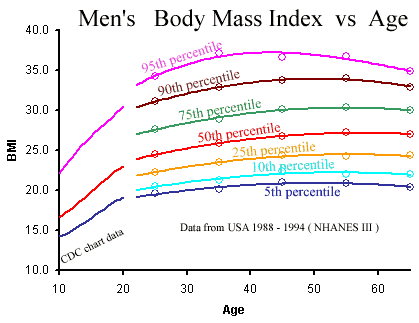
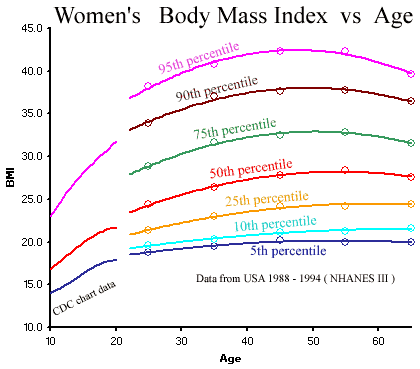
• When calculating BMI age is not a consideration (variable); however, it must be considered for growing humans. Charts provided by the CDC graph percentiles for ages up to twenty years. Below 5 percentile = underweight & above 95 percentile = overweight.
• When calculating BMI age is not a consideration (variable); however, it must be considered for growing humans. Charts provided by the CDC graph percentiles for ages up to twenty years. Below 5 percentile = underweight, above 85 percentile = overweight, & above 95 percentile = obese.
|

|
• Percentile BMI graphs age scaled for adult men & women are shown below. Adult age changes the impact of BMI very little. The adult table above is usually an adequate placement tool.


Ψ Variations in Health
• In developed nations, children between 7 & 11 are the healthiest humans of all; they are least likely to die or become seriously ill or injured.
Ψ Brain Development in Middle Childhood enhances:
• Selective Attention - the tuning out of unwanted information.
• Automatization - a process by which thoughts & actions are repeated in
sequence so often they become automatic, or routine, & no longer require conscious thought.
|


